Note: this window can be left open while reclustering the same coda set with different parameters to allow comparison of different results.
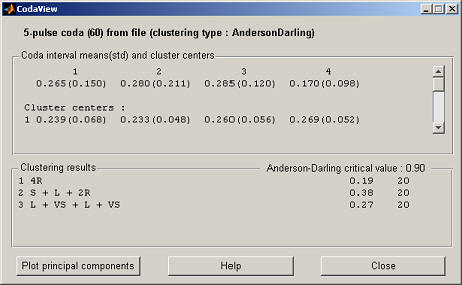
Coda interval means(std) and cluster centers
The first two lines in this panel show the mean values and standard deviations of the pulse intervals of this coda set. Following these lines are the centers of every cluster found in this coda set.
Clustering results
This panel shows the name for every individual cluster together with its Anderson-Darling statistic (depending on the selected clustering algorithm) and the number of codas in the cluster. Note that when clusters with identical rhythms were combined the statistic is the average of the combined clusters. When the statistic is 0 it means the cluster was not tested for normality because there were too few codas to continue clustering.
View ratios
This button is only available if the data is clustered with the variance ratio criterion. It plots a graph of the variance ratios for the different models tried. The selected model is shown in red.
Plot principal components
Produces a graph with all the clusters plot in the direction of the two principal components of the data. To associate the clusters with their names the legend can be added from the figure's insert menu.
Help
Shows this help page.
Close
Closes the viewing window.
Click here to go to the main index.