This example will demonstrate the complete process of coda clustering. It will cover the various ways to enter data into the program, setting the clustering parameters, viewing the cluster results and saving the clustered data.
Data Entry
The first step is to create some sample data and for this the test_data_creation.m script can be used. This script will create two variables with coda data, a cell-array named cdata containing coda sets with varying lengths and a matrix named cmatrix which holds data for one specific coda length. The coda matrices should have the codas as rows and pulse intervals as columns. It will also create a comma separated file called test_data.csv that contains the codas of cdata.
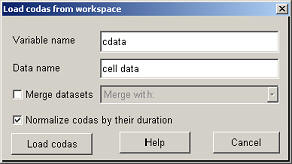
To load the data in the analyzer (after starting the program with CodaAnalyzer) click on "Load data from workspace".
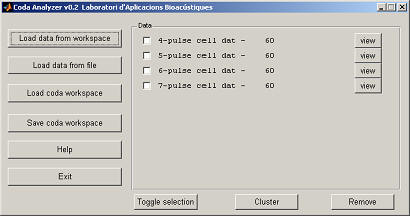
To import the cell array the variable name should be set to 'cdata', the data name can be any name, for example 'cell data' and the normalization of the codas should be checked. Clicking on "Load codas" will load the data. The main window should now looks like this :
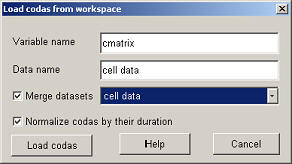
The program can also read matrices, to load cmatrix click again on "Load data from workspace" and now the variable name should be set to cmatrix. The matrix contains 5-pulse codas, which were already in the cell array. In order to combine the matrix data with the existing codas check "Merge datasets" and then select the name of the other dataset ('cell data').
The main window now has changed to :

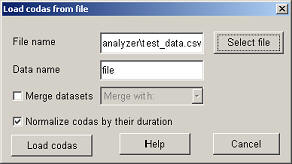
The other way to import data is from a comma (or some other character) separated file. To open test_data.csv click on "Load data from file" and give as file name 'test_data.csv' (or use "Select file" to find it on the disk). Set "Data name" to 'file' (or something else...) and click on "Load codas".
This should start the Matlab import wizard and you can just click through it. The main window now looks like this (codas are ordered by the number of pulse intervals) :

In case you accidently close this window, if at startup of the program data from a previous session is still loaded in the workspace (the CODA_DATA variable is defined) the program will ask if the existing data should be used or if it should be overwritten.
Data Clustering
After the data is loaded it can be clustered. Select one or more codas and then click "Cluster". This will show the cluster parameter window,

This example will use g-means, normally the number of iterations for any of the methods should at least be higher than 10 (you can experiment with a correct setting clustering the data with a different number of iterations and watch how the number of clusters found change). In the case of g-means the number of iterations can be disabled to select a deterministic initialization of k-means. The critical value can stay at 0.9 and it should not be necessary to combine identical rhythms. Click on "Cluster" and the program will cluster the data (which should take a second). It should have found 3 clusters, depending on the randomly generated data. To see the effect of the critical value you can use the other data set (assuming you loaded both the cell array and the file) and cluster it with different settings. A large cv will end up with one cluster due to the less strict normal distribution requirement, while a small value will create many clusters. A lookup table can be used to find appropiate values, 0.9 relates to an alpha-value of around 0.03.
Data Viewing
After the data is clustered it the result can be viewed by clicking on "view".
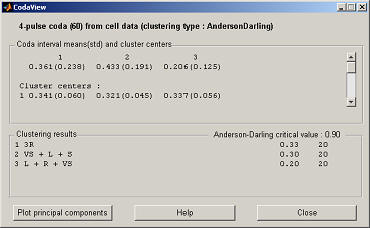
The cluster centers are given in the top panel, the bottom panel gives the name of each cluster with the Anderson-Darling statistic and the number of codas in the cluster. If the variance ratio criterion has been chosen then there will be an additional button in the top right corner to view the ratios and the selected local maximum (this is especially important to check if automatic selection was set). To view the spread of the clusters click on "Plot principal components" which plots the two principal components of the data against each other and gives the percentages of the total variance explained by the components.
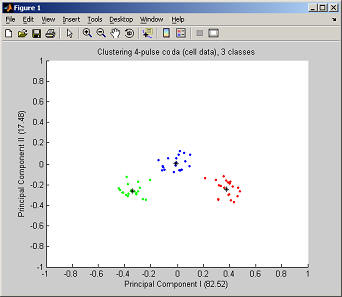
To match a cluster with its name insert the legend through the Insert menu.
Storing and loading the workspace
The entire workspace of the coda analyzer can be stored by clicking on "Save coda workspace" in the main window. This will store all data, together with the clusters and parameters as a normal Matlab file. This can be loaded in the analyzer again with "Load coda workspace", or ofcourse directly into Matlab with the usual 'load' command. In the last case, the coda analyzer will detect the data on startup and ask if it should be loaded (if you say no it will overwrite the existing data). All data is always accessable in the Matlab workspace using the command 'global CODA_DATA'. If required for further analysis the coda and cluster data can be copied from the structure, but it is not recommended to change values in the structure while the analyzer is running.
Click here to go to the main index.